|
|
|
1.
|
Alex is comparing the number of births in the western provinces. He found the
information in the two double-bar graphs shown below.Use these bar graphs to answer the following
questions. 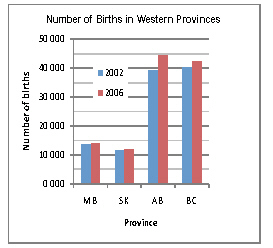 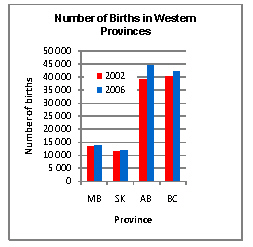 Which comparison do
these graphs show? a. | the comparison between the number of births in 2002 and the number of births in
2006 | b. | the comparison between the provinces | c. | the comparison between the first graph and the
second graph | d. | the comparision between different sources |
|
|
|
2.
|
The double-bar graphs above show the same data. Why do they look
different?
a. | the colours in the legends are different | b. | the titles look
different | c. | the scale for the number of births is different | d. | the second graph is
narrower than the first graph |
|
|
|
3.
|
Estimate the number of births in Manitoba (MB) in 2002.
a. | 15 000 | b. | 14 000 | c. | 20 000 | d. | 10
000 |
|
|
|
4.
|
Estimate the number of births in Saskatchewan in 2006.
a. | 12 000 | b. | 10 000 | c. | 15 000 | d. | 20
000 |
|
|
|
5.
|
Which province had the most births in 2002?
a. | Manitoba (MB) | c. | Alberta (AB) | b. | Saskatchewan (SK) | d. | British Columbia
(BC) |
|
|
|
6.
|
Which province had the most births in 2006?
a. | Manitoba (MB) | c. | Alberta (AB) | b. | Saskatchewan (SK) | d. | British Columbia
(BC) |
|
|
|
7.
|
Which province had the largest increase in the number of births between 2002 and
2006?
a. | Alberta (AB) | c. | Saskatchewan (SK) | b. | British Columbia (BC) | d. | Manitoba (MB) |
|
|
|
8.
|
Sandra drew this double-bar graph to compare the average rainfall in two cities
in British Columbia. Use this graph to answer the following questions. 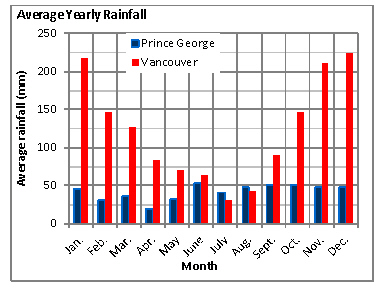 Which two cities are being compared? a. | Vancouver and Whistler | c. | Comox and Prince George | b. | Vancouver and Prince
George | d. | Whistler and
Comox |
|
|
|
9.
|
Which city has the most yearly rainfall?
a. | Prince George | c. | Whistler | b. | Comox | d. | Vancouver |
|
|
|
10.
|
Which city had the most rainfall in July?
a. | Vancouver | c. | Prince George | b. | Comox | d. | Whistler |
|