|
|
|
1.
|
Caelan surveyed two local schools to find out the students’ favourite
water sport. He displayed his data in this double-bar graph.Use this graph to answer the following
questions. 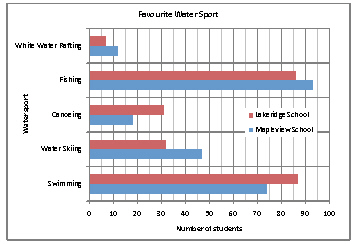 What does the legend on the graph tell you? a. | the list of water sports | c. | the number of
students | b. | the colour for each school surveyed | d. | the number of students
surveyed |
|
|
|
2.
|
What does the vertical axis of the graph represent?
a. | the list of water sports | c. | the schools that were
surveyed | b. | the number of students surveyed | d. | the colour for each school
surveyed |
|
|
|
3.
|
What does the horizontal axis of the graph represent?
a. | the colour for each school surveyed | c. | the number of
students | b. | the schools that were surveyed | d. | the list of water
sports |
|
|
|
4.
|
Why did Caelan use red and blue for his graph?
a. | red and blue are Caelan’s favourite colours | b. | the red represents
the number of students from Mapleview School and the blue represents the number of students from
Lakeridge School | c. | Caelan wanted to make the graph colourful | d. | the red represents
the number of students from Lakeridge School and the blue represents the number of students from
Mapleview School |
|
|
|
5.
|
Use the graph to select the statement that is true.
a. | Fishing and swimming are the two most favourite sports for the students at both
schools. | b. | Red and blue are the two most favourite colours of the students at both
schools. | c. | More students at Mapleview like canoeing than students at
Lakeridge. | d. | Fewer students from Mapleview like water skiing than students at
Lakeridge. |
|
|
|
6.
|
Cassie asked students from two schools what their favourite ice cream flavour
is. She collected the data shown in the table. She then constructed the double-bar graph to compare
the data.Use the graph to answer the following questions. Flavour of Ice Cream | Northern Heights School | Eastview School | 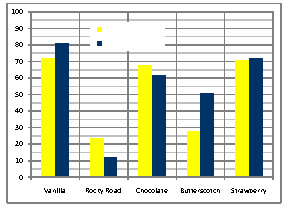 | | Vanilla
| 72 | 81 | | Chocolate | 68 | 62 | | Strawberry | 59 | 72 | | Butterscotch | 28 | 51 | | Rocky
Road | 24 | 12 | | | | | | | | | | | | |
Which axis shows the
number of students? a. | horizontal | b. | bottom | c. | vertical | d. | top |
|
|
|
7.
|
What scale did Cassie use for the vertical axis?
a. | the scale goes up by 20 | c. | the scale goes up by
100 | b. | the scale goes up by 10 | d. | the scale goes up by 50 |
|
|
|
8.
|
What title should Cassie use for the horizontal axis?
a. | Northern Heights School | c. | Number of
Students | b. | Eastview School | d. | Flavour of Ice Cream |
|
|
|
9.
|
How should Cassie label the legend?
a. | yellow is Northern Heights School and blue is Eastview School | b. | yellow is vanilla
and rocky road and blue is chocolate and butterscotch | c. | blue is Northern Heights School and yellow is
Eastview School | d. | blue is the larger numbers and yellow is the smaller
numbers |
|
|
|
10.
|
What title should Cassie use for her graph?
a. | Favourtie Teacher | c. | Favourite School | b. | Favourite Colour | d. | Favourite Ice Cream
Flavour |
|