|
|
|
1.
|
Use the graph below to answer the following questions. 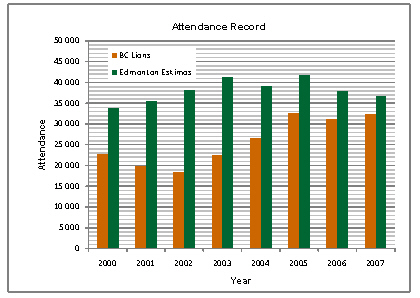 What do the bars in this double-bar graph represent? a. | they show different heights for orange and green bars | b. | they show the
attendance for each team from 2000 to 2007 | c. | they represent the different
years | d. | they represent the favourite CLF team |
|
|
|
2.
|
What is the scale of the vertical axis on the graph?
a. | the scale goes up by 5000 | c. | the scale goes up by 20
000 | b. | the scale goes up by 10 000 | d. | the scale goes up by 50 000 |
|
|
|
3.
|
What does the horizontal axis show on the graph?
a. | the attendance | b. | the colour | c. | the year | d. | the
team |
|
|
|
4.
|
What does the legend on the graph tell you?
a. | the attendance from 2000 to 2007 for the BC Lions and the Edmonton
Eskimos | b. | the BC Lions favourite colour and the Edmonton Eskimos favourite
colour | c. | the orange bars represent the attendance for the Edmonton Eskimos and the green bars
represent the attendance for the BC Lions | d. | the orange bars represent the attendance for
the BC Lions and the green bars represent the attendance for the Edmonton
Eskimos |
|
|
|
5.
|
During which year did the BC Lions have their highest attendance?
|
|
|
6.
|
During which year did the Edmonton Eskimos have their highest attendance?
|
|
|
7.
|
What was the attendance for the BC Lions in 2007?
a. | 32 000 | b. | 27 000 | c. | 37 000 | d. | 42
000 |
|
|
|
8.
|
What was the attendance for the Edmonton Eskimos in 2005?
a. | 38 000 | b. | 37 000 | c. | 42 000 | d. | 40
000 |
|
|
|
9.
|
During which year was there the biggest difference in attendance between the BC
Lions and the Edmonton Eskimos?
|
|
|
10.
|
Which question could you use the graph to answer?
a. | Which team’s attendance record improved from 2000 to 2007? | b. | What is the BC
Lions’ and the Edmonton Eskimos’ favourite colour? | c. | What are the names
of three CFL teams? | d. | During which years did the BC Lions and the
Edmonton Eskimos play? |
|